
Viana™, a wordplay on Vision Analytics, is meldCX's flagship product. Our main vision was to help businesses gain actionable insights using IoT hardware and machine learning at the edge and vision AI.
It's your own data science team in a box.
I joined meldCX early January 2020 as a Junior Experience Engineer with it being my first UX role after transitioning as a front-end developer. I was placed with the Viana design team, working closely with two other junior designers, one who specializes in Visual Design and the other as the principal designer for Viana.
It was a thrilling challenge to be able to design for AI technology, a domain that is fairly new and promising to a young designer like me. It was an opportunity to dip my toes into the world of UX and AI, both of which were my college thesis' main technology interests. Our goal was to pave way for Viana to become a premier and and innovative Vision Analytics solution, one that could help and empower businesses, and ultimately, create meaningful impact.
For our MVP, we started with an Audience Measurement solution which is a high-performance and autonomous face mapping and detection solution that extracts real-world data into metric data. Using data gathered from sensors, we are able to tell meaningful data stories and translate them into actionable insights. My main role at this time was to create high-fidelity user interfaces for the MVP both for the web portal and the edge live view (desktop application).

After launching our first successful solution for a customer, our team started to reduce from three down to one, as my colleagues were placed in other projects.
Five months into my job, I was promoted as Viana's principal Experience Engineer. Some of my key responsibilities included:
Right after I was promoted to become Viana's principal designer, the pandemic hit and our company had to face a few major setbacks.
We pivoted and brainstormed for a more relevant solution that features the heat mapping capability of Vision Analytics, and so came SAMi.
SAMi® was born out of the challenges brought about by COVID-19 in its early days. In what was dubbed as the new normal, we became increasingly cautious of the surfaces we interact with in public, from ATM machines, kiosks, restaurant tables, and more.
SAMi® monitors surface area touches and makes them visible, allowing for strict cleaning efforts while tracking compliance.
Our goal for SAMi was to help businesses reduce touch interactions with common touch points such as door knobs, tables, chairs, screens, and more. Furthermore, we wanted to let businesses know whether these surfaces exceeded the set maximum threshold and was time for cleaning via a text message or a notification.
SAMiE was officially launched on August 2020 as a POC.
My role during this time, besides the overarching responsibilities of being an Experience Engineer, was to design for the SAMi MVP from ideation to development, working closely with our Product Manager in defining the scope, constraints, timelines, and priority features in order to hit the go to market.
Our scope included platforms such as the web portal, mobile application, and a desktop app.
For the web portal, the user (site admin) would be able to access the following features to integrate and use SAMi, this included:
%20%E2%80%93%201.jpg)
For the desktop live view, the user (technical staff) would be able to access the following features to integrate and use SAMi, this included:

For the mobile PWA, the user (cleaner) would be able to access the following features from SAMi, this included:
We opted for a PWA to make development effort quick (since time was a big constraint) and easy to access from all platforms (android, ios, etc).

Much later into our venture, we started to add more solutions into Viana, which we eventually called Service Applets. Service Applets are basically AI models created to service a particular use-case.
People counting anonymously tracks people within a defined space, measuring data such as foot traffic, demographics, behavior, and visit duration to build better customer on-site experiences.
Our goal was to design and solve the growing need to measure real estate footprint and visualize relevant insights as to how space is being utilized.
We had a timeline of 2 months to deploy a ready build for People Counting and come up with a lean, feasible design in 1-2 weeks.
Solution requirements:

Eventually, we started to observe a pattern with our Service Applets.
The inspiration for the Scene Editor designs came from that realization, giving us the chance to build a scalable and reusable Scene Editor that can accommodate any type of Service Applet, thereby reducing time for UI design and putting us back up to speed.

View the case study and the design process on People Counting and floors plans here.
With retail stores slowly opening up and accepting customers back again, opportunities for tracking customer activity in-store has been increasingly in demand in the market. Tracking customer in-store activity provides a wide opportunity for transforming in-store data into actionable insights.
Our goal was to help our customers understand business intelligence in stores and improve their overall retail operations through Zone Engagement.

After receiving the brief, we (products, sales, and experience team) started to discuss and understand the problem presented by our customers. We conducted a brief research on market competitors provided by our sales team and together with the Product Manager, we discussed constraints, scope of work, project objectives, timeline, and key product personas.
Our timeline required us to deploy to product in 2 months, which meant that time for design was limited by a huge lot.
As a baseline, we decided to prioritize the following features for our POC:
Our criteria in deciding which features to prioritize was determined by the high-level user journey and categorized in must have (highest priority), should haves (high priority), could haves (mid priority), and nice to haves (high priority).


Our team managed pull through the timeline and deployed Zone Engagement in record time. With our POC solution, our customer will be able to capture persona-related insights, including number of people in store, average time of visit, zones / products engaged with among others, visualized through the floor plan and insights.
If successful it is anticipated that each store will be 450 AUD per month / per site @ 200 stores.
Long term, we hope to scale the product from tracking customer entry and exit activity through Zone Engagement to tracking customer touch points in shelves through Shelf Engagement to tracking which products they interacted with through Product Engagement, and intelligently gather shopping insights similar to AmazonGo.
Viana, as a smart solution, aims to make it simple and cost-effective for businesses to develop, deploy, and manage large scale commercial applications. Through SAM Lines, we enable customers from different industries (eg. retail, production, food and business, etc) to solve custom business problems in three easy steps: Scan, Analyze, and Manifest.
Scan - Enable sensors read real-world metadata
Analyze - Analyze data detected by sensor
Manifest - Save a digital log of events detected by Viana
Problem: Our customer realized they were sitting on a huge amount of loss per annum, due to human error in the product packaging stage. How might we help their business cut down losses through Computer Vision?
Our Solution: SAM Lines - where Viana acts as a ‘human assist’ camera to detect and prevent these errors. Each step completed are verified and recorded on the Viana manifest to provide data for traceability.
After discussing and understanding the problem from a business and user standpoint, we went straight into research on the HOW, how do we make it possible for Viana to accommodate this use case while being an out of the box solution?
We needed a clear understanding of what features are needed to set the solution up, the journey from A to B, and how everything ties together from the high-level vision down to the nitty gritty details.
We started by identifying the constraints and the context of the solution we were building.
And there were more, but these were the most pressing questions at that time.

We established that we needed a Planogram View to model their real world product placements. This will also be a part of our roadmap once we explore the Shelf Engagement service applet.
We had to build it in a way that it was scalable where facings and its products were easy to update, create, and replicate.
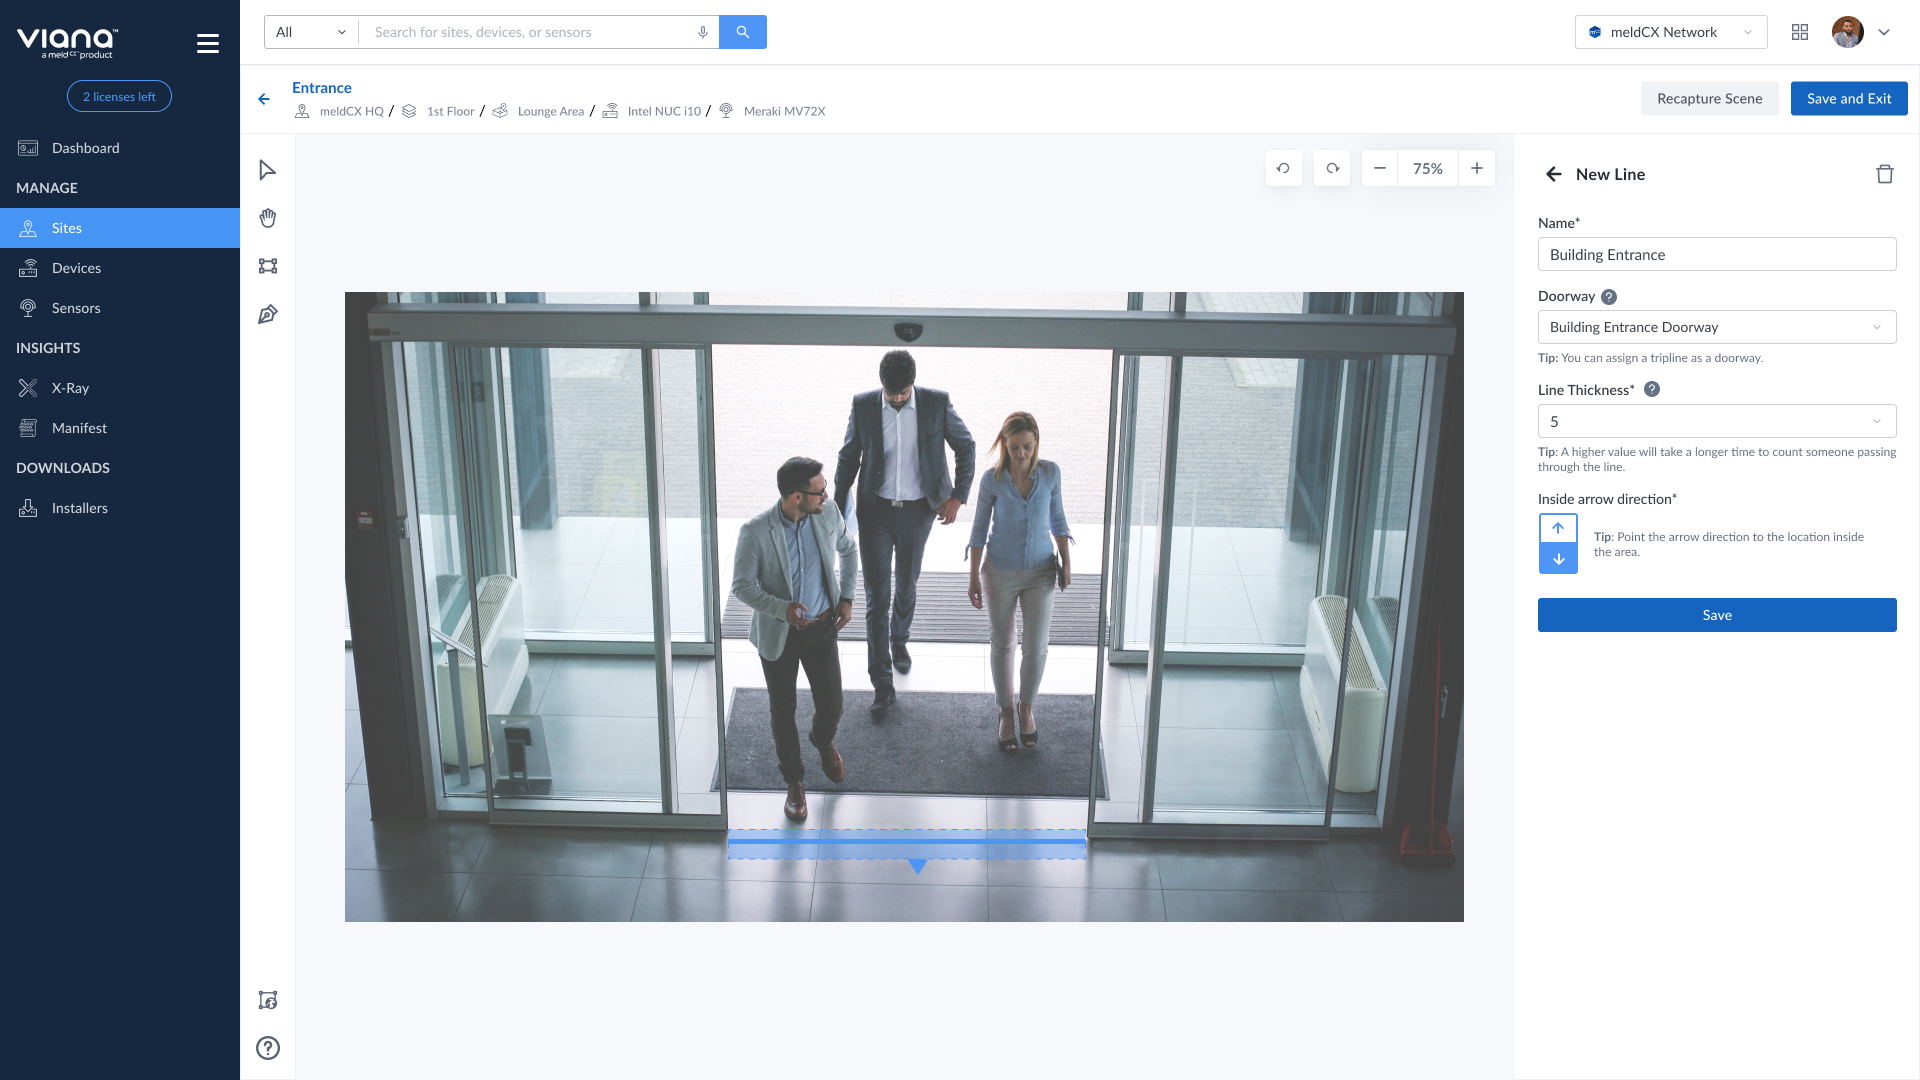
To make sense of every feature and possible scenarios, together with my co-designer, we created a user flow for the SAM Lines set-up journey. It starts when the user uploads a planogram, adds facings and products, link these products with the scene editor through the Shelf.

The journey starts when the user adds products into facings to model real-world product placements.

Getting data from the real-world requires Viana to capture a Scene (a still image of the camera's field of view). The captures are then traced and labelled with their corresponding data and tags.

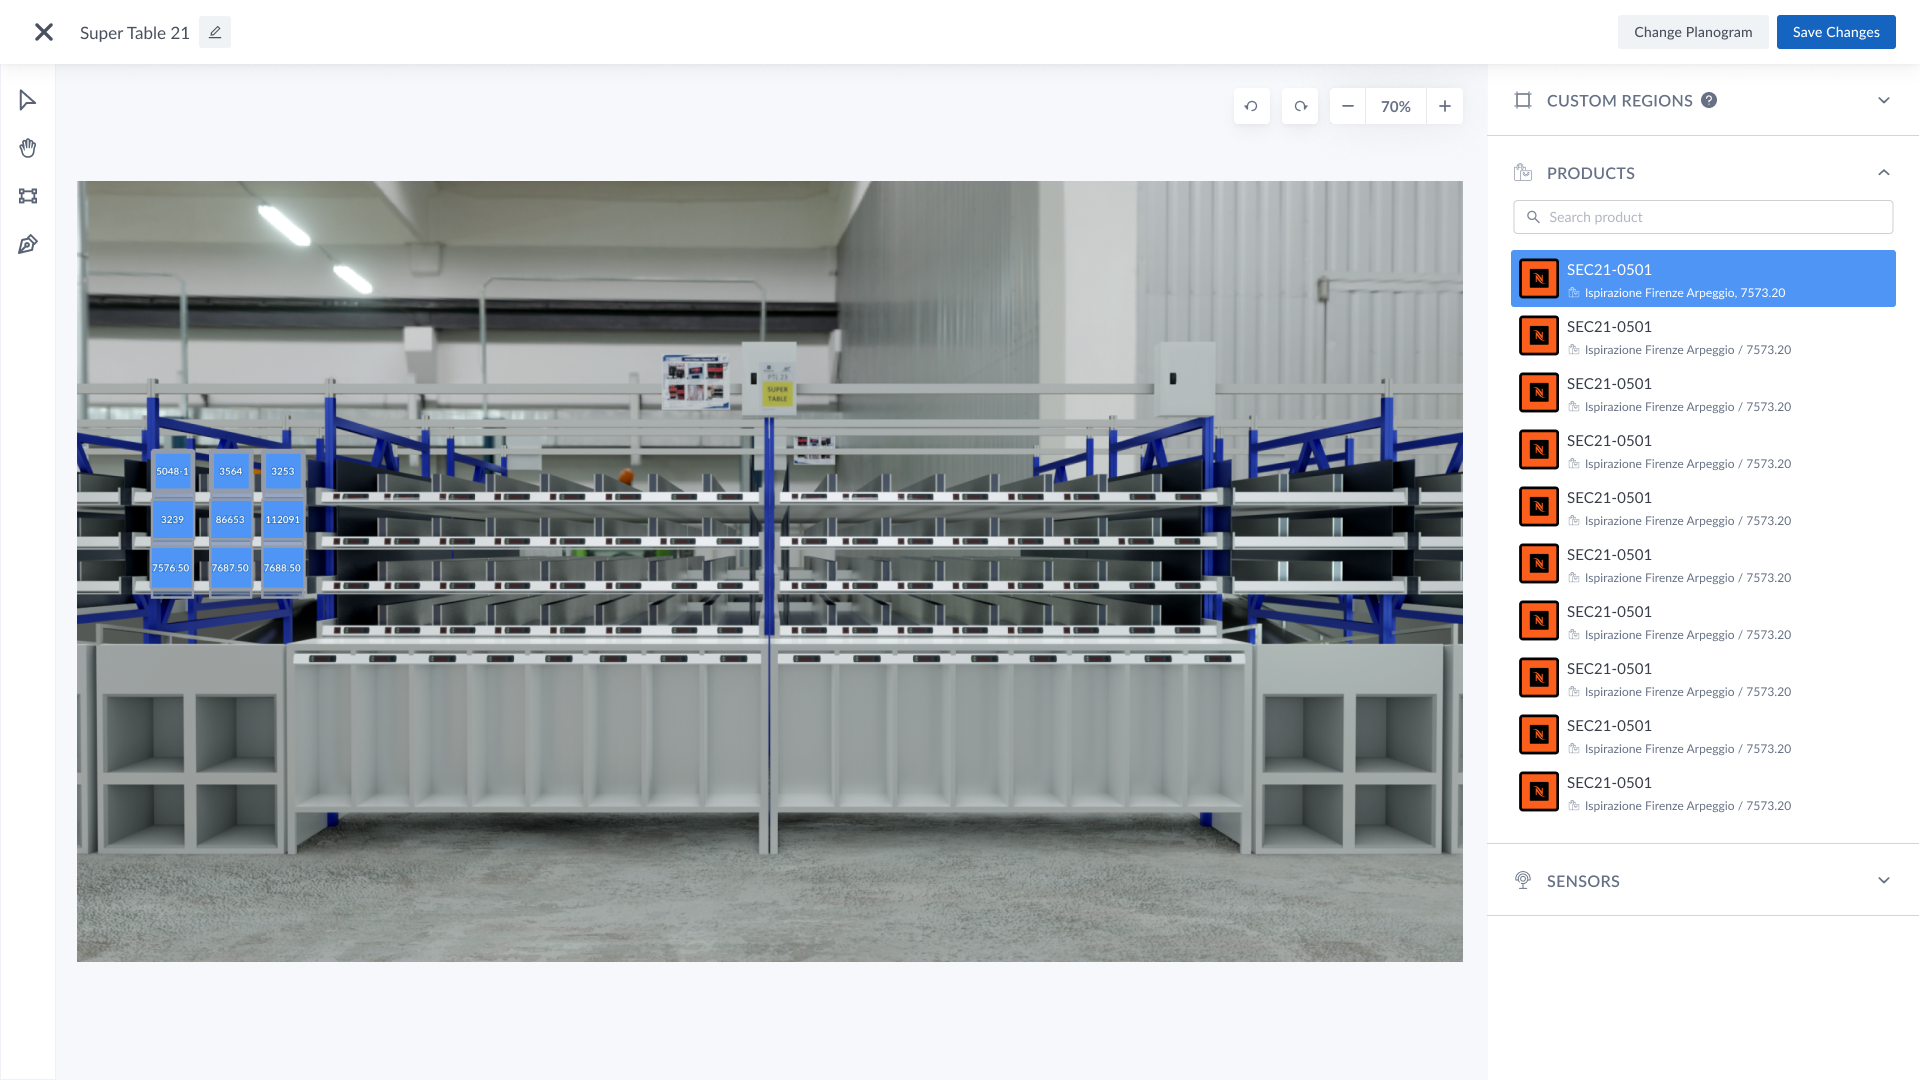
Link scene editor regions and planogram products through the Shelf.
View a digital manifest or log of all events occurring in the network from any service applet.
.png)
Another challenge we faced was that the customer wanted to view the products in SKUs instead of product photos. However, this feedback came after development. As a compromise, we created a filter view where users can pick if they wanted to view SKUs or product photos.

Go live date is in Jan 2022 at their main distribution centre. It is anticipated that initial implementation and model is 150K USD up front signed. Upon successful pilot, its anticipated revenue with 20 lines in Paris alone is 20k USD per month, with the opportunity for global expansion.
-
Other solutions worked on but not discussed in this case study:


